“Life is what happens when you’re busy making other plans.” – John Lennon
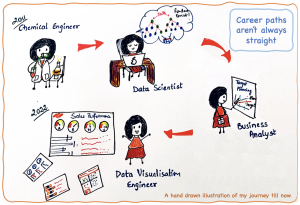
As a young professional based in Bangalore, India, my career journey so far has been unexpected but incredibly rewarding. Growing up, I didn’t know what I wanted to do, so I opted to study engineering since it’s considered a good career track. Based on the score I got on the national entrance test for universities, I was admitted to the National Institute of Technology, Jalandhar, focusing on chemical engineering. It was an ecstatic moment, and for the next four years, I loved learning about oil, sugar, paint, leather technology and what not.
Navigating Reality
After graduation, as much as I wanted to get a job in core chemical engineering, destiny had something else in store for me. Very few chemical companies visited campus and I didn’t land a job at the ones I aimed for. On the other hand, a plethora of IT and analytics firms visited campus. There was a lot of buzz around data analytics at that time and the idea of solving business problems using data sounded intriguing, so I decided to give it a try.
I ended up at Mu Sigma as a data scientist, where I learned all about programming, problem solving, dashboarding and client interactions. My biggest takeaway was: Anything can be learned – if you are willing to put in the effort.
I liked the work but wanted something more creative. So I found a job at American Express as a business analyst. This role got me closer to the business and the art of problem solving. After working for a year, I realized that Tableau dashboarding was the only part of the job that I truly enjoyed since I loved creating stories and visuals. But I didn’t want to be a Tableau developer, I wanted to be a storyteller/dashboard designer/solution consultant. This led me to take a bold move and leave my job to learn more about design and storytelling.
Explorations Lead to Discovery
I took 3 months to learn about design and then looked for jobs that would allow me to use my creative skills in coming up with analytical solutions. It was definitely not easy as those kinds of roles are not specifically available out there. After trying for 2 years and working a few different jobs, I finally found a role as a data artist as a contractor for VMware.
The work, which was less technical and more creative, gave me a chance to create user-friendly Tableau stories that helped the business gain insights at a glance to enable faster decision making. It was surprising how I started loving working on Fridays and there were no Monday blues as I loved what I was doing.

Coming to Palo Alto Networks
I’ve come to believe that things have a way of working out once you know what you really want. When my contract with VMware was expiring and I was about to start working for another client, someone senior in my network suggested that I try to get in touch with Palo Alto Networks as the company could use someone of my potential in IT.
There was no position for what I was doing but I decided to give it a try. I prepared a pitch on my strengths, my background in analytics and design, the kind of work I have done, and the kind of feedback I have received. Then I reached out to Palo Alto Networks’ VP of Data and Analytics on LinkedIn asking for a connection to showcase some of my work. The VP was kind enough to respond and gave me an opportunity for interviews. The rest, as the saying goes, is history.
Our Bangalore Office is Growing Fast
It’s been over a year since I joined the Palo Alto Networks’ Bangalore office. I love my work, the smart people around me, the innovative and supportive culture we’re building together, and our new vibrant office space. It’s amazing to see the growth of the company even though we’re a satellite office. I was the first hire in my team and today we have over 20 people. We are about to reach 1000 employees here in Bangalore and I can’t wait to celebrate this milestone!
Work Becoming my Passion
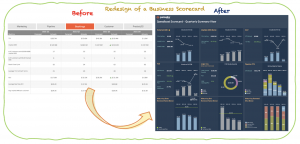
As a senior data visualization engineer, I work with product managers to create user-friendly and visually pleasing analytical dashboards for their respective business areas. This could be making Tableau mockups using raw data, redesigning existing dashboards, designing the logo for an app we’re building, creating standards for fonts and colors, and so on.
One of my favorite projects is designing a suite of dashboards to provide deeper visibility into cloud hosting costs incurred by the company. With growing operations and client base, cloud spend has increased considerably over the years and it’s hard to keep track of it using reports shared by the cloud service providers.
This ongoing project includes some challenges, including: How do we come up with designs that help finance, product, and engineering teams get the insights they need? How do we tell visual stories for each phase of this big project and make sure these dashboards are actionable for each stakeholder?

The solution was not in planning, but in iterations driven by continuous communication and feedback which helped us design a single summary tab that can serve multiple stakeholders at leadership level. When we complete this project, the dashboards will be able to highlight areas of high spend, areas of neglect, and opportunities to cut down costs which can potentially save millions of dollars for the company. I love working with different teams to understand how we can together solve interesting problems and make a positive impact for the business.
Don’t Ever Settle!
It’s ok to not know what’s next, it’s ok to give yourself time to figure things out, but what’s not ok is to settle for something you are not passionate about. I finally discovered my calling after exploring various options. Trust me when I say I am a wandering soul and if I can do it, anyone can. I believe that life has a way of leading us to where we need to be. You are never too old to learn something new or open up to new possibilities. But once you find your calling, make sure to give your 200%. To come full circle, let me end with a John Lennon quote: “If it’s not ok, it’s not the end.”


