Customer retention is one of the primary growth KPIs for any company that has a subscription-based business model. Competition is tough in the SaaS market, where customers are free to choose from plenty of service providers in a given product category. A customer who has bad experience – even once – may move to a competitor, resulting in customer churn. Even worse, if droves of unsatisfied customers churn at a clip, both material losses and reputation damage would be enormous for a company.
In the cybersecurity industry, there’s been a shift to the SaaS business model. For Palo Alto Networks, it means that multiple products have moved to a subscription-based business model, so customer retention has become a critical area to pay attention to.
ML Solution for Proactive Customer Retention
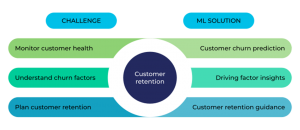
We faced three significant challenges in retaining high-churn customers:
- How to automatically identify the customer with a high likelihood of churn, with comprehensive customer health assessment
- How to help the business stakeholders, e.g., customer support managers (CSM), understand the impact factors on customer churn
- How to provide actionable insights to proactively retain each high-churn customer so that the efficiency of CSM work can be improved
To solve this, we developed three machine learning models:
- Customer churn prediction model, to predict and identify the high-churn customers
- Customer churn driving factor insight model, to discover the impact factors that cause churn occurrence
- Customer retention guidance model, to provide customized engagement recommendations to retain high-churn customers
Customer Churn Prediction Model
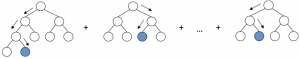
To start out, many underlying customer health indicators were extracted from over 10 different data sources like customer demographics, product adoption, support cases, marketing campaigns, etc. Then, feature selection was conducted to remove the insignificant or collinear indicators. We chose the best subset of indicators to build the churn prediction model. Gradient boosting is a powerful machine learning technique that helped us produce a prediction model in the form of an ensemble of weak prediction models, typically decision trees. When the decision tree is a weak learner, the resulting model is called gradient boosting trees.
The challenge of building a gradient boosting trees model is hyperparameter optimization. Different from model parameters, the hyperparameters of a machine learning model are the parameters that must be arbitrarily set before starting training, e.g., the number of estimators in the gradient boosting trees model. Overall, the hyperparameters of the gradient boosting trees model can be divided into three categories.
- Tree-specific parameters: the hyperparameters affect each individual tree in the model
- Boosting parameters: the hyperparameters affect the boosting operation in the model
- Miscellaneous parameters: other hyperparameters for the overall functioning
Considering the computing efficiency and implementation complexity, the grid search strategy is employed to tackle the challenges of hyperparameter optimization.
Customer Churn Driving Factor Insight Model
We used correlation analysis to quantitatively assess the influence of the health indicators on customer churn. A correlation coefficient measures the extent to which two variables tend to change together. The coefficient describes both the strength and the direction of the relationship. We adopted a generic correlation measurement to generalize the assessment to cover more generic patterns (linear and nonlinear) between health indicators and churn occurrence.
The correlation coefficient is a nonparametric measure of rank correlation (statistical dependence between the rankings of two variables). It assesses how well the relationship between two variables can be described using a monotonic function. The coefficient is normalized to the value from -1 to +1. The sign of the coefficient indicates whether it is a positive or negative correlation. A positive correlation means that as one variable increases, the other variable also tends to increase. A negative correlation signifies that as one variable increases, the other tends to decrease. The values close to -1 or +1 represent stronger relationships than the values closer to 0. In churn analytics, the coefficient is essentially a marginal conditional probability and can be interpreted as the average impact on churn likelihood given the change of an indicator.
Customer Retention Guidance Model
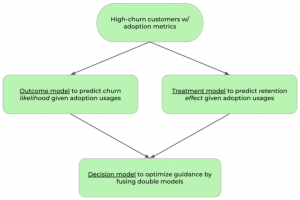
Customer success managers perform a variety of actions to encourage customers to renew their subscriptions. A critical question is what action is most likely to decrease churn possibility for a customer who is predicted to be high churn.
The retention guidance model assesses all the possible actions and estimates the effects for a particular high-churn customer. A double machine learning estimator is developed, where two base models, i.e., outcome model and treatment model, are built to estimate churn likelihood and retention effect given an engagement action, respectively. The two base models are then combined to form a recommendation engine for customer engagement planning. Equipped with the model output, a customer success manager can construct an optimal engagement plan tailored to an individual customer.
What’s innovative here is that it’s the first ML-driven retention guidance model that is tailored to individual high-churn customers, providing retention recommendations for customer engagement.
A 360 View of Customer Health
Compared to the existing work of customer retention, the churn prediction model provides a 360 degree view of customer health assessment by scoring customer churn possibility. The insight of driving factors supports not only customer managers to prevent customer churn, but also the product management team to identify product issues and corporate strategy for leadership. The retention guidance model provides recommendations to the customer managers to optimize the engagement plan for each high-churn customer with an estimate of required effort and expected effect to remediate customer attrition.
Cloud-Based Churn Analytics Pipeline Operationalization
Building a machine learning model is about solving a business problem. But the model can only do so when it’s in production and actively consumed by end-users. As such, model deployment is just as important as model building.
To deploy the ML solution and operationalize it in the business, a generalized customer churn analytics pipeline has been built by assembling all the ML models in the generic google cloud infrastructure. Multiple tools and techniques were applied to the cloud-based model operationalization, including:
- GitHub for model development collaboration and version control
- Google Cloud Storage (GCS) to host python runtime scripts and ML models
- Google BigQuery to store churn prediction scores and retention recommendations
- Apache Airflow to orchestrate workflow and automate daily job scheduling
- Google Cloud Dataproc to execute ETL pipeline and predictive jobs with Spark support
Keeping Customers Happy
Customer churn rate is one of the most important health indicators for any subscription-based business. Being able to successfully identify unhappy customers, discover churning patterns, and provide actionable recommendations for customer retention will allow you to learn about your product weakness, operational issues, as well as customer preferences and expectations.
The ML solution we developed provides a comprehensive assessment of customer health and supports customer managers to proactively retain high-churn customers and reduce the churn rate. By operationalizing it for multiple products, we are achieving strong performance for customer retention and helping our business to improve efficiency.


